Good strategy needs good data. At CIMView we collect and store publicly available ERCOT price data and store it in the cloud, ready to query at a moments notice. As experts in the ERCOT marketplace, we also know how to turn that data into actionable reports and visualizations.
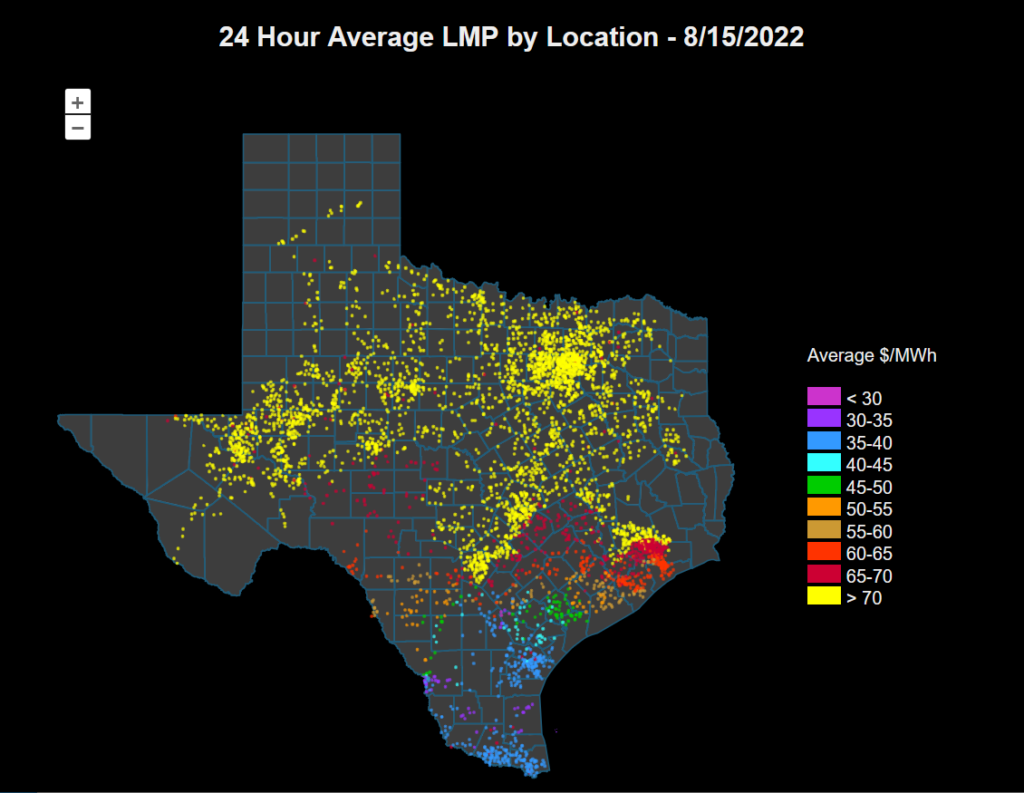
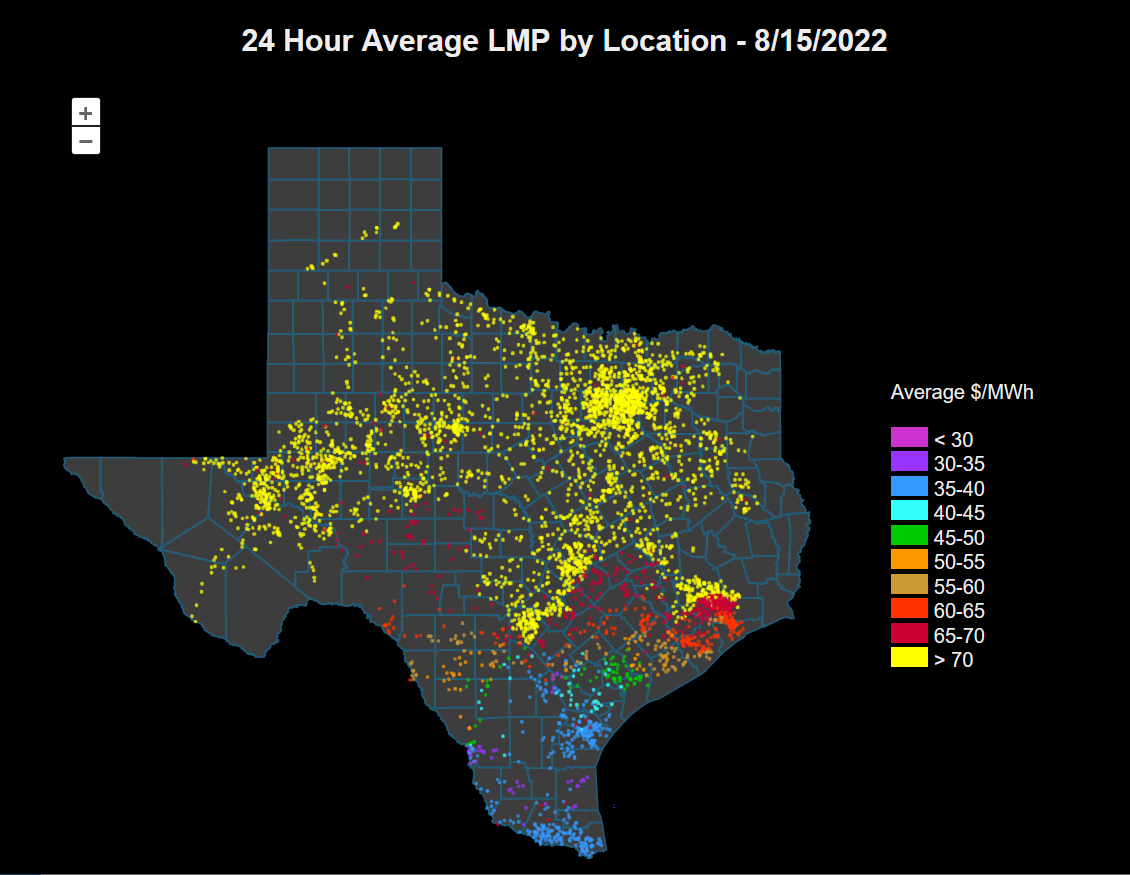
In this example, we leveraged our CIM Insight product to map electrical buses in the publicly available “Locational Marginal Prices (LMPs) by Electrical Bus” report to specific substations and locations. To make the chart, 24-hour average electrical bus prices from 8/15/2022 are compared at each substation. A color scale is applied and the results are overlaid on a map of Texas. (The demonstration mode of CIM Insight was enabled to make this chart, which moves all locations 2.5 miles in a random direction to maintain ECEII compliance for this post.)
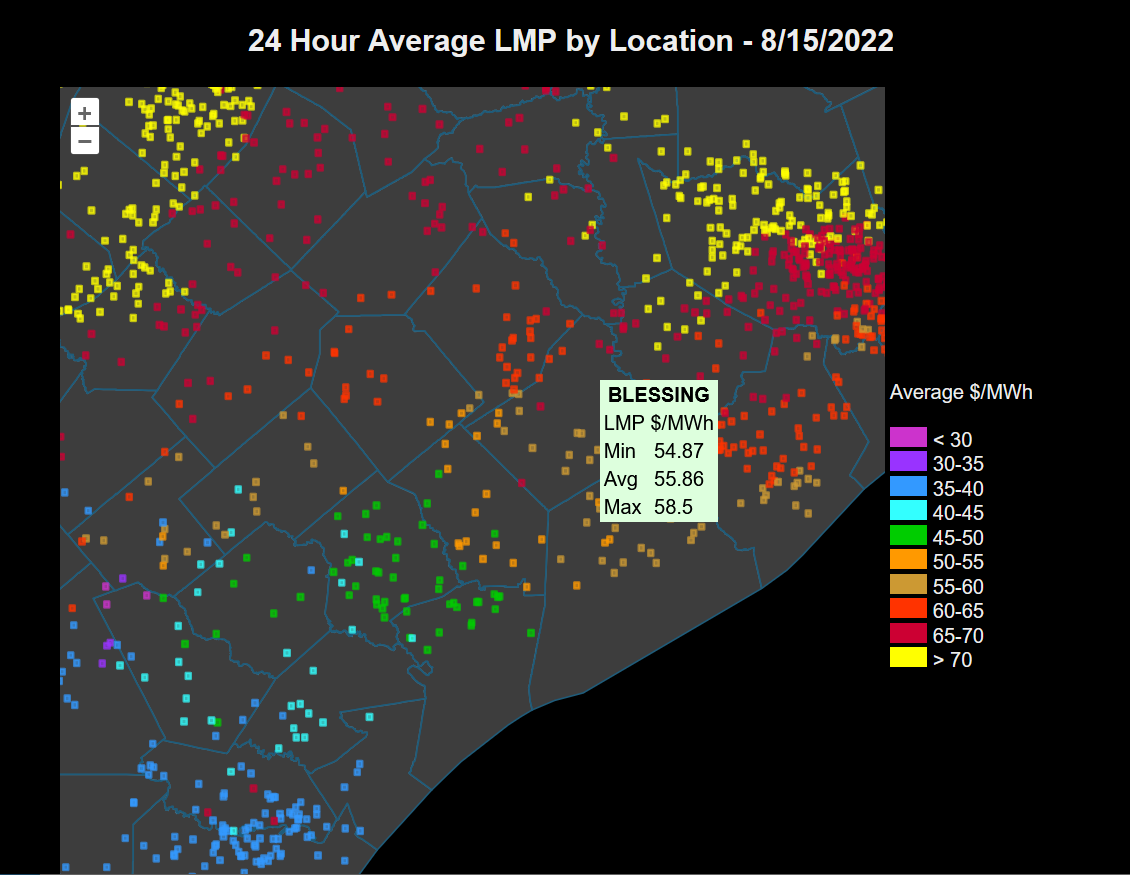
Locations for substations for which data was not supplied were interpolated from nearby substations using a bus/branch model of the power grid. The chart can zoom and pan, and hovering over a particular substation can pull up more detailed information. For example, on the day in focus the Blessing substation had a small spread of prices. A look at a CIM Insight produced node/breaker diagram of this substation (with contemporaneous outages applied) reveals that there were slightly different prices in regions of differing voltage.
Although the visualizations are useful for spotting trends or outliers quickly, the data are also available in spreadsheet format. The charts were created with Openlayers v7.1.0 from a geographic KML file produced by CIM Insight overlaid on a map obtained from the State of Texas Open Data Portal. The KML file produced by CIM Insight is also viewable in standard viewers such as Google Earth.